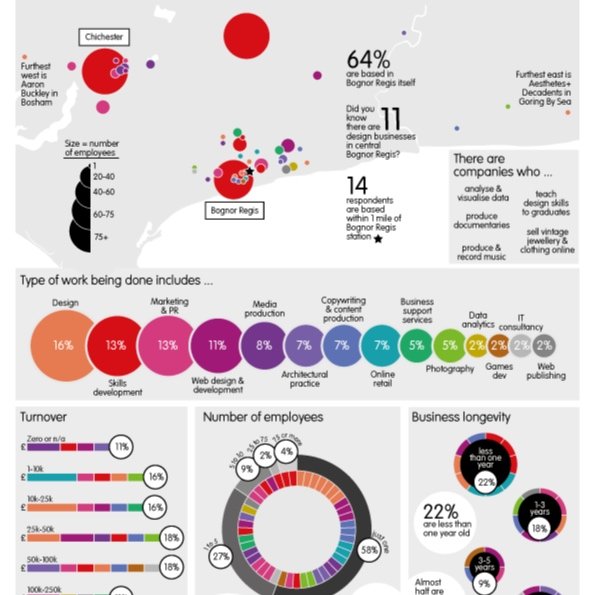
diagrams, charts & maps
pie charts, bar charts, flow charts, oh my!
A sure fire way of livening up your slides, reports, website and social feed … information is transformed into an easily digestible graphic. Give us the content, we’ll do the rest.
Featured